| Population by Age and Area | ||||
|---|---|---|---|---|
| Area | 0 - 15 years | 16 - 64 years | 65+ years | Total |
| Derby | 54,956 | 174,676 | 44,517 | 274,149 |
| Derbyshire | 137,322 | 499,035 | 186,020 | 822,377 |
| Amber Valley | 21,569 | 78,858 | 30,024 | 130,451 |
| Bolsover | 14,300 | 52,218 | 17,255 | 83,773 |
| Chesterfield | 17,604 | 64,755 | 23,686 | 106,045 |
| Derbyshire Dales | 10,111 | 40,615 | 21,031 | 71,757 |
| Erewash | 19,174 | 70,825 | 24,254 | 114,253 |
| High Peak | 14,973 | 55,690 | 21,296 | 91,959 |
| North East Derbyshire | 17,684 | 62,527 | 26,435 | 106,646 |
| South Derbyshire | 21,907 | 73,547 | 22,039 | 117,493 |
| Source: Mid-year estimates 2024 | ||||
North East Derbyshire
Locality
North East Derbyshire
Diabetes
Dementia
Smoking
Ageing Population
Demographics

 Introduction
The district of North East Derbyshire is situated in the northeastern area of Derbyshire, in England, on the edge of the Peak District National Park. It is a predominately rural area, with beautiful countryside and contains some urban settlements. The towns and villages across the district are diverse, with varying levels of local amenities. Housing types are also varied in terms of size, character and standard. Some older housing is in poor condition and other settlements have energy efficient new builds, with affordable housing options. Plus, listed buildings and tourist attractions. There are 45,990 households, 24% of households with dependent children, 6% lone parent households and 15% lone pensioner households. North East Derbyshire has the second fewest households, and the fourth highest population, of all the Derbyshire districts. Approximately 105,035 people lived in North East Derbyshire (in 2023), according to the North East Derbyshire 2025 Area Summary Profile.1
The district comprises of four main towns - Dronfield, Eckington, Killamarsh and Clay Cross (Dronfield being the largest town in the district). Plus, numerous smaller villages scattered across the district and surrounding rural areas. The more rural areas are situated predominantly in the south and west of the district. The district covers over 107 square miles (276 km2). Spanning from Dronfield, Eckington & Killamarsh in the northern part of the district (which borders onto Sheffield and Bolsover District). Extending down to areas such as Clay Cross, Stonebroom and Shirland in the Southern part of the district (which borders Amber Valley and Bolsover Districts). The district mostly surrounds Chesterfield (Borough), which is the largest town within Derbyshire, bordering around three sides of the Chesterfield area.

WARD REFERENCE
01: Ashover
02: Barlow & Holmesfield
03: Brampton & Walton
04: Clay Cross North
05: Clay Cross South
06: Coal Aston
07: Dronfield North
08: Dronfield South
09: Dronfield Woodhouse
10: Eckington North
11: Eckington South & Renishaw
12: Gosforth Valley
13: Grassmoor
14: Holmewood & Heath
15: Killamarsh East
16: Killamarsh West
17: North Wingfield Central
18: Pilsley & Morton
19: Ridgeway & Marsh Lane
20: Shirland
21: Sutton
22: Tupton
23: Unstone
24: Wingerworth
North East Derbyshire District is ranked as the third most deprived district in Derbyshire, containing pockets of high levels of deprivation that fall within the (20%) most deprived areas, in England. Six Lower Layer Super Output Areas (LSOAs) in North East Derbyshire are shown in the data, all of which fall within the most deprived 20% of areas nationally according to the 2019 Index of Multiple Deprivation (IMD). Of these, three LSOAs in the wards of Grassmoor, Holmewood & Heath, and North Wingfield Central are in the most deprived 10% (IMD decile 1). The remaining three, located in the wards of Clay Cross South, Shirland, and Tupton, fall into the second most deprived decile (decile 2). This indicates that all six areas experience significant levels of deprivation, with half situated among the most disadvantaged communities in England and all within the bottom 20% nationally.2
The district has an industrial heritage and was a major producer of coal, with numerous coal mines sited in North East Derbyshire. Coal mining was formerly the main industry in the region for many decades, until its decline and final closure of collieries in the 1990’s, resulting in high unemployment levels. Regeneration has since taken place creating new housing, business parks, employment (largely low paid & low skilled opportunities) and industrial estates, which have significantly increased investment within the area.
The district overall, has good transport and commuting opportunities. The A61 and M1 provide connectivity across the breadth of the district. Junctions (29, 29A & 30) of the M1 connect into Holmewood, Arkwright and Renishaw. However, high volumes of traffic (& increased housing developments) often cause congestion points, air pollution and delays to public transport.
There is one train station located within North East Derbyshire District in Dronfield, which is situated between Chesterfield and Sheffield, providing services on the Midland mainline. The Chesterfield and Alfreton mainline railway stations are accessed nearby (situated outside of the North East Derbyshire District), supporting commuting to work and access to wider locations for leisure and social activities.
The main acute healthcare is provided by Chesterfield Royal Hospital, supported by East Midlands Ambulance Service (EMAS). There are numerous GP Practices and Primary Care Networks (PCNs) across the district. These include South Hardwick, Chesterfield & Dronfield, Derbyshire Dales, North East Derbyshire, and North Hardwick & Bolsover PCN. These teams bring GP Practices together and coordinate with local organisations to provide patient-centred integrated health and social care services for the local population.
The governance and core services across North East Derbyshire are provided by Derbyshire County Council and North East Derbyshire District Council, with town/parish councils throughout the district. The core voluntary sector provision is offered by organisations including Derbyshire Voluntary Action, Links CVS and Chesterfield Volunteer Centre all supporting and advocating for numerous local groups, communities, charities and initiatives.
The district towns and villages are diverse, with hidden pockets of high deprivation and significant local challenges, which may not be highlighted amongst broader higher-level data and rural aspects. To address these challenges placed based approaches, interventions and collaborative working across different organisations and sectors is taking place to support local communities. The public health locality team and a range of partners across the different sectors, focus upon working together and sharing insight to have a greater impact and develop more of a whole systems approach to improving population health outcomes for communities and residents, within North East Derbyshire District.
 Why is it important to Population Health?
Health inequalities are defined as unfair and avoidable differences in health outcomes between different groups of people or populations - such as differences in how long we live, the age at which we get preventable diseases or health conditions. The health & wellbeing of our population is influenced by the wider (social) determinants of health which encompass a diverse range of social, economic and environmental factors such as housing, income, education, environment, amenities, social networks etc. Including the conditions of where people are born, live, work and age. These factors impact positively or negatively upon a person’s health, lifestyle choices and their quality and quantity of life. Hence, inequalities in these wider determinants of health contribute to preventable ill health and premature mortality. Also highlighting numerous areas to focus upon to reduce inequalities, improve health & wellbeing and enable the people of North East Derbyshire to live healthier & longer lives.
The Area Health Profile (2023) highlights that district has a higher proportion of older people and a smaller proportion of younger people, compared to the England average, yet appears more similar in comparison to the Derbyshire average (aged 65-84 years being slightly higher than Derbyshire). With the highest percentage of the population being aged between 45 to 56 years (in 2021). Alongside the ageing population, the district (when compared to the Derbyshire average) has higher rates of people receiving long-term support in the community, unpaid care provision and limited day-to-day activities.3 However, the data for male life expectancy at birth (80.4 years), is better than the Derbyshire & England average. The female life expectancy at birth (84.0 years), is similar to the Derbyshire & England average.4 Even though life expectancy figures are good, the above indicates people are more likely to be living in poorer health and with long term conditions. This potentially impacts upon people’s quality of life (healthy life expectancy). Plus, accessibility to amenities, opportunities and services to support their health and wellbeing. In turn, poorer health increases the likelihood of needing support or healthcare services, which have limited resource and are in high demand. This further supports the need for more preventative approaches, collaborative working and joined up person centred services in communities, that are more easily accessible for people locally.
The North East Derbyshire Public Health Outcomes Framework5 highlights the following indicators, which are significantly worse than the England average:
- Children in absolute low income families (under 16s)**
- Children in relative low income families (under 16s)
- The rate of complaints about noise (All ages)
- Percentage of adults meeting the ‘5-a-day’ fruit and vegetable consumption recommendations (new method) (16+ yrs)
- Overweight (including obesity) prevalence in adults, (using adjusted self-reported height and weight) (18+ yrs)
- Admission episodes for alcohol-related conditions (Narrow) (All ages – Female)
- Percentage reporting a long-term Musculoskeletal (MSK) problem (16yrs+)
- Chlamydia detection rate per 100,000 aged 15 to 24 yrs (Female)
- HIV late diagnosis in people first diagnosed with HIV in the UK (15yrs+ - Persons)*
- Emergency readmissions within 30 days of discharge from hospital
- Estimated dementia diagnosis rate (aged 65 and older)
Addressing priority areas identified by data sources at a locality level allows for partnership working to target resources and maximise reach to the populations with the greatest need. Using evidence-based practice to shape action to improve health outcomes and reduce health inequalities.
 The Derbyshire Population Health Approach
The Derbyshire Population Health Approach focuses on prevention, population health, evidence-informed practices, causes, and collaboration. It emphasises proactive measures to prevent health issues, tailors interventions to specific populations, incorporates evidence-informed practices, addresses underlying causes, and promotes collaboration for effective action.
When considering North East Derbyshire within The Derbyshire Population Health Approach:
• Prevention
There are specific interventions, local partnerships and initiatives across North East Derbyshire focusing upon prevention and addressing identified priorities.
The Healthy North East Derbyshire Partnership6 collaborates across the different sectors to identify, highlight and address key priorities across the lifecourse, within North East Derbyshire District. Some of these priorities include supporting older people, increasing physical activity and improving mental health and wellbeing etc.
Improving mental health and emotional wellbeing is a priority within the Healthy North East Derbyshire Partnership Plan; commissioning ‘Thr1ve’ to deliver social prescribing services for children and young people across the district. Providing a preventive early intervention programme. Offering person-centred support, enabling children to develop resilience and make positive changes to their lives. The public health locality and mental health & suicide prevention teams provide targeted promotion, disseminate messaging across local partner organisations and attend local events to raise awareness of mental health & wellbeing resources, services, information & local training. The campaigns promoted include ‘5 Ways to wellbeing’, ‘the Baton of Hope’ and ‘Let’s Chat’ (providing links to services & information via key rings, plaques on benches, signs in bus stops and the ‘Let’s Chat’ map, which highlights places in nature to visit etc). Also, Perinatal Mental Health Support and Neurodivergent Groups are available to access locally.
There are numerous different physical activity offers, opportunities and schemes in the district. North East Derbyshire District Council (NEDDC) & their Health and Wellbeing Teams deliver and support a variety of physical activity approaches locally. The three leisure centres have been renovated providing fitness, aerobics, healthy lifestyle, mind and body workouts and varied wider facilities such as cafe’s and hosting wider community services. Including the Clay Cross Active new build, completed in 2025 (previously Sharley Park Leisure Centre). The Walking Into Communities Officer role supports the physical activity agenda, based & core focused within Clay Cross (funded via multiple partners and managed by NEDDC) enabling people to become more physically active and feel less isolated. Plus, initiating and supporting development of numerous local walks led by locally trained volunteers, and local projects. There are also numerous different levels and types of physical activity offers across the district delivered by other organisations including the Falls Prevention Service, Live Life Better Derbyshire, Rkyneld Homes and other local partners, volunteers and businesses: providing a range of chair-based exercise, yoga, Live Stronger For Longer classes, Octago, Kurling and relaxation based sessions.
• Population
The total population (in 2023) was approximately 105,035, with people aged 16-64 being the highest percentage of the population (59%) and the lowest aged 0-15 years (17% of the population).7 The latest 2021 census reports that the population in North East Derbyshire has increased by 3.0%, from around 99,000 in 2011 to 102,000 in 2021 (people aged 65 years and over increased by 20.9%; people aged 15-64 years decreased by 3.5%; children aged under 15 years increased by 4.1%). Also, over half (55%) of the population in North East Derbyshire were aged 21 to 64 years, (similar to the Derbyshire & England average). Furthermore, North East Derbyshire has the second highest population of people aged 65 years and over, in the whole of Derbyshire (24.8% of the population). Also, 20.2% of the North East Derbyshire population being aged 20 years & under (compared to 20.8% in Derbyshire & 23.1% in England).8
North East Derbyshire (NED) District has some areas experiencing significantly high levels of deprivation (as highlighted above), amongst the most disadvantaged communities in England. For example, the largest town within North East Derbyshire District is Clay Cross which sits within the 20% most deprived areas in England (IMD overall Data), having a considerable amount of North East Derbyshire’s population and footfall. This is a key area of focus for partners locally and the town is now undergoing significant regeneration (following Towns Fund investment) and has a large newly built housing development.
According to the NED Public Health Outcomes Framework Summary (May 2025) the Children in absolute low-income families (under 16s) & Children in relative low income families (under 16s) are significantly worse compared to the England average (in 2022/23). However, the Children in low income families (all dependent children under 20) is significantly better than the England average in 2016.9 There is a Financial Inclusion Group for partners across Chesterfield, North East Derbyshire and Bolsover, working in collaboration across the financial inclusion agenda.
The public Health Locality Team and local partner organisations analyse data, considering different population demographics and local insight (as some elements can be masked within overall quantitative data) to identify different patterns and health needs of different population groups to guide planning and delivery of interventions to improve health and wellbeing on a wider scale. This population health approach aims to improve health at population (rather than just at an individual level) addressing the wider determinants of health to tackle the root causes of health disparities and poor health. Taking a holistic preventative perspective and also supporting access to services to maintain health and live well for as long as possible. Input is needed and valued from numerous partner organisations, communities, local authority teams & public health, the NHS and voluntary sector to all influence and action the approach effectively and meet the needs of our communities. Numerous key voluntary organisations, community workers and members of the community are providing excellent provision to support local residents and provide local groups across the area.
• Evidence
The public health approach implements evidence-based practice. Using research and evidence to inform decisions, develop interventions, guide policies and influence change. A mixed method evidence-based approach can be useful at a locality level to gain context, lived experience, identify local priorities and shape shared goals to develop action and effective interventions locally. Using both quantitative and qualitative data sources (i.e. public health outcomes framework and local insight gathering) and aligning with local and national strategies.
Data is analysed and used (particularly the public health outcomes framework) to identify the priorities for the Healthy North East Derbyshire Partnership Plan which aims to build, promote and support the health and well-being of local people within North East Derbyshire. Working in collaboration with stakeholders across the statutory, community and voluntary sectors, focusing upon prevention and addressing the wider determinants of health to reduce health inequalities (differences) and the improve health and wellbeing of north-east Derbyshire residents. Developing new initiatives, joining up and maximising resource, supporting and empowering local communities, and in turn reducing the increasing costs and demand on services. The inclusive partnership approach and local delivery across sectors enables a wide range of interventions to meet the diverse needs of local people and communities across the life course. Ranging from small grassroots groups to larger commissioned services.
• Causes
There are many causes and factors that influence peoples physical and mental health & wellbeing and contribute to poor health, including social and economic factors, physical environment, individual lifestyle behaviours, access to amenities and health care. These factors are often known as the ‘causes of the cause’ and the wider or social determinants of health. Addressing and understanding these underlying route causes, the wider determinants of health i.e. housing, income, employment and education, are key to improving health and wellbeing, tackling health inequalities and supporting people to live happier and healthier lives.
Evidence suggests tackling these has greater influence on people’s health, than health care services in isolation, although they have a vital role: 80% of factors influencing health outcomes are non-clinical and 20% are clinical care. The Derbyshire Joint Health and Wellbeing Strategy (2024-2027)10 focuses on five areas to improve health and highlights four main risk factors to tackle that lead to poor health (which are smoking, physical inactivity, diet and alcohol) to reduce harm and preventable mortality. These are the main areas and services delivered by Live Life Better Derbyshire, Derbyshire County Council Public Health.
Gaining insight about local communities and understanding the main causes that contribute to poor health will help organisations and communities to address these. As an example, the data shows within North East Derbyshire there is a high prevalence of overweight (including obese) adults. The percentage of adults walking (8.3%) and cycling (0%) for travel is also significantly worse than the England Average, and the majority of residents commute to work by car. [Sport England, 2019]. Local cycling and walking routes have been developed, including the ’5 Pits Trail’ and ‘The Avenue’ providing physical activity/active travel opportunities and connectivity across the district, in addition to a range of physical activity offers. The area health profiles indicate high rates of care in the community and limited day-to-day activity.
Local insight demonstrates numerous potential barriers such as financial difficulties, mobility needs, lack of confidence and unconducive environments. The Active Neighbourhood Pilot and consortium of local stakeholders are working in collaboration to increase levels of walking and physical activity in a more organic way. Aiming to increase walking for travel within and between key communities, better connect communities, and improve health and wellbeing. This pilot project is focusing predominantly within Danesmoor (and Clay Cross) with a target audience of families and children, as identified by physical activity/inactivity local data. Taking a more person-centred holistic approach, considering a range of influences, barriers and lifestyles. Engaging and consulting with the local community members in various formats such as events, community activities, surveys and community consultations. Planning and implementing innovative ways of working with communities, across sectors and systems to better understand and support the local community. Exploring local walking behaviours and challenges, interests and opportunities, health needs and wider environmental issues locally to shape the approach and develop new initiatives. The ‘walking’ and ‘moving more’ aim underpins all the work, without being forefront of the promotion to aid a more holistic community focus, increase engagement and walking by stealth. Hence developing the ‘Clay Cross Out and About’ phrase and logo (designed by a child within a local school) to be more community friendly and recognised locally.
• Collaboration
Working in collaboration across different sectors and levels is essential in delivering a population health approach. Involving a range of voluntary, community and statutory partners and organisations. Including healthcare providers, policymakers, local communities, community interest companies, local authorities and public health teams etc. Developing a shared vision and purpose between partners and across sectors. Working at a locality level to address wider determinants of health, reduce health inequalities and promote equitable health outcomes.
There are various strategic partnerships within North East Derbyshire which include a range of cross sector partners. Such as, the Place Alliance, Community Safety Partnership, and the Healthy North East Derbyshire partnership. Feeding into the Health and Wellbeing Board and Integrated Care Board. The numerous thematic subgroups and local partnership groups within the locality area(s) enable collaboration and action on specific local priorities and areas of focus: including the Financial Inclusion Group (Chesterfield & NED), Healthy Ageing NED Subgroup, Clay Cross Heath Futures Group, Active Neighbourhood Pilot, Dronfield 2gether Network, Community Hubs Network, Social Connectedness Action Group, Voluntary Sector Forum etc. These partnerships are invaluable and instigate collaborative action, shared priorities, connect partners and avoid duplication. They are built on open and trusting relationships, distributed leadership, shared learning and knowledge, combined expertise and resource.
The Healthy North East Derbyshire Partnership is led by both Derbyshire County Council Public Health & North East Derbyshire District council, working in collaboration with various partners across different (community, statutory and voluntary) sectors to improve health outcomes and reduce health inequalities. The Healthy North East Derbyshire Partnership Plan identifies specific priorities to address. These are to ensure the best start for children and young people, improve mental health and wellbeing, promote healthy lifestyles, support older people, build healthy resilient communities and financial inclusion. Working alongside numerous organisations, using evidence-based and community focused preventative approaches, providing funding and enabling delivery a range of tailored interventions/projects to meet the local need.
 Latest Derbyshire Data
| IMD by Area | |||||||||||
|---|---|---|---|---|---|---|---|---|---|---|---|
| Local Authority | 1 - Most deprived | 2 | 3 | 4 | 5 | 6 | 7 | 8 | 9 | 10 - Least deprived | Total |
| Amber Valley | 4,716 | 8,508 | 11,266 | 8,920 | 26,013 | 9,625 | 16,559 | 16,122 | 17,856 | 9,244 | 128,829 |
| Bolsover | 2,912 | 14,754 | 15,950 | 15,830 | 11,419 | 8,497 | 1,723 | 8,660 | 1,560 | 0 | 81,305 |
| Chesterfield | 9,500 | 21,344 | 15,412 | 13,405 | 10,405 | 5,056 | 11,473 | 3,029 | 9,819 | 5,487 | 104,930 |
| Derbyshire Dales | 1,641 | 0 | 0 | 0 | 8,152 | 11,734 | 10,935 | 12,723 | 18,143 | 9,094 | 72,422 |
| Erewash | 6,010 | 10,670 | 17,801 | 3,670 | 11,476 | 9,793 | 16,825 | 10,670 | 10,906 | 17,511 | 115,332 |
| High Peak | 4,251 | 1,466 | 3,753 | 10,645 | 11,985 | 7,543 | 8,879 | 21,780 | 12,454 | 9,877 | 92,633 |
| North East Derbyshire | 5,237 | 5,111 | 9,503 | 12,116 | 11,182 | 10,868 | 13,186 | 7,878 | 16,057 | 11,078 | 102,216 |
| South Derbyshire | 0 | 5,617 | 4,759 | 4,539 | 16,952 | 14,589 | 8,444 | 20,263 | 15,741 | 18,612 | 109,516 |
| Derbyshire County | 34,267 | 67,470 | 78,444 | 69,125 | 107,584 | 77,705 | 88,024 | 101,125 | 102,536 | 80,903 | 807,183 |
| Source: Ministry of Housing, Communities and Local Government IMD 2019, ONS LA mid-year population estimates 2020 | |||||||||||
| IMD by Area | |||||||||||
|---|---|---|---|---|---|---|---|---|---|---|---|
| Local Authority | 1 - Most deprived | 2 | 3 | 4 | 5 | 6 | 7 | 8 | 9 | 10 - Least deprived | Total |
| Amber Valley | 3.7 | 6.6 | 8.7 | 6.9 | 20.2 | 7.5 | 12.9 | 12.5 | 13.9 | 7.2 | 100.0 |
| Bolsover | 3.6 | 18.1 | 19.6 | 19.5 | 14.0 | 10.5 | 2.1 | 10.7 | 1.9 | 0.0 | 100.0 |
| Chesterfield | 9.1 | 20.3 | 14.7 | 12.8 | 9.9 | 4.8 | 10.9 | 2.9 | 9.4 | 5.2 | 100.0 |
| Derbyshire Dales | 2.3 | 0.0 | 0.0 | 0.0 | 11.3 | 16.2 | 15.1 | 17.6 | 25.1 | 12.6 | 100.0 |
| Erewash | 5.2 | 9.3 | 15.4 | 3.2 | 10.0 | 8.5 | 14.6 | 9.3 | 9.5 | 15.2 | 100.0 |
| High Peak | 4.6 | 1.6 | 4.1 | 11.5 | 12.9 | 8.1 | 9.6 | 23.5 | 13.4 | 10.7 | 100.0 |
| North East Derbyshire | 5.1 | 5.0 | 9.3 | 11.9 | 10.9 | 10.6 | 12.9 | 7.7 | 15.7 | 10.8 | 100.0 |
| South Derbyshire | 0.0 | 5.1 | 4.3 | 4.1 | 15.5 | 13.3 | 7.7 | 18.5 | 14.4 | 17.0 | 100.0 |
| Derbyshire County | 4.2 | 8.4 | 9.7 | 8.6 | 13.3 | 9.6 | 10.9 | 12.5 | 12.7 | 10.0 | 100.0 |
| Source: Ministry of Housing, Communities and Local Government IMD 2019, ONS LA mid-year population estimates 2020 | |||||||||||
| Population by Ethnicity (percentage) | |||||
|---|---|---|---|---|---|
| Area | Asian, Asian British or Asian Welsh | Black, Black British, Black Welsh, Caribbean or African | Mixed or Multiple ethnic groups | White | Other ethnic group |
| England | 9.6 | 4.2 | 3.0 | 81.0 | 2.2 |
| Derby | 15.6 | 4.0 | 3.7 | 73.8 | 2.9 |
| Derbyshire | 1.5 | 0.5 | 1.4 | 96.3 | 0.3 |
| Amber Valley | 1.0 | 0.3 | 1.2 | 97.3 | 0.2 |
| Bolsover | 0.9 | 0.5 | 0.9 | 97.4 | 0.3 |
| Chesterfield | 1.9 | 0.8 | 1.4 | 95.5 | 0.4 |
| Derbyshire Dales | 0.7 | 0.2 | 1.0 | 97.8 | 0.3 |
| Erewash | 1.6 | 0.8 | 1.8 | 95.4 | 0.4 |
| High Peak | 0.8 | 0.2 | 1.3 | 97.4 | 0.2 |
| North East Derbyshire | 0.9 | 0.3 | 1.1 | 97.4 | 0.2 |
| South Derbyshire | 3.6 | 0.8 | 1.8 | 93.1 | 0.7 |
| Source: Census 2021 | |||||
Trend Data
The following charts show life expectancy over time in Derbyshire by district and sex (compared to England)
PHOF Profile
Notes:
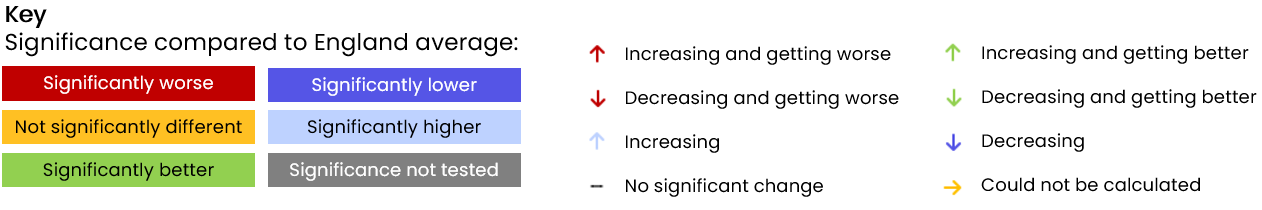
- For indicators that aren’t straightforward to determine whether a high value is good or bad are shaded in blue rather than red/amber/green.
- Recent trend refers to analysis done by Fingertips which tests for a statistical trend. Please see the Fingertips tool for full details.
- Increases and decreases are only shown if they are statistically significant.
| A. Overarching indicators | ||||||||
|---|---|---|---|---|---|---|---|---|
| Indicator | Age | Sex | Period | Value | East Midlands region | England | Unit | Recent Trend |
| A01b - Life expectancy at birth | All ages | Male | 2023 | 80.4 | 78.9 | Inf | Years | |
| A01b - Life expectancy at birth | All ages | Male | 2021 - 23 | 79.5 | 78.8 | Inf | Years | |
| A01b - Life expectancy at birth | All ages | Female | 2023 | 84.0 | 82.7 | Inf | Years | |
| A01b - Life expectancy at birth | All ages | Female | 2021 - 23 | 83.2 | 82.6 | Inf | Years | |
| A02a - Inequality in life expectancy at birth | All ages | Male | 2021 - 23 | 7.9 | 10.1 | 10.5 | Years | |
| A02a - Inequality in life expectancy at birth | All ages | Female | 2021 - 23 | 9.3 | 7.9 | 8.3 | Years | |
| A01b - Life expectancy at 65 | 65 | Male | 2023 | 19.2 | 18.6 | 18.8 | Years | |
| A01b - Life expectancy at 65 | 65 | Male | 2021 - 23 | 18.7 | 18.5 | 18.7 | Years | |
| A01b - Life expectancy at 65 | 65 | Female | 2023 | 21.4 | 20.9 | 21.3 | Years | |
| A01b - Life expectancy at 65 | 65 | Female | 2021 - 23 | 20.9 | 20.8 | 21.1 | Years | |
| A02a - Inequality in life expectancy at 65 | 65 | Male | 2021 - 23 | 5.1 | 5.3 | 5.6 | Years | |
| A02a - Inequality in life expectancy at 65 | 65 | Female | 2021 - 23 | 6.3 | 4.8 | 5.0 | Years | |
| Source: OHID Fingertips | ||||||||
| B. Wider Determinants of Health | ||||||||
|---|---|---|---|---|---|---|---|---|
| Indicator | Age | Sex | Period | Value | East Midlands region | England | Unit | Recent Trend |
| B01b - Children in absolute low income families (under 16s) | <16 yrs | Persons | 2023/24 | 17.4 | 20.7 | 19.1 | % | |
| B01b - Children in relative low income families (under 16s) | <16 yrs | Persons | 2023/24 | 20.6 | 24.1 | 22.1 | % | |
| B03 - Pupil absence | 5-15 yrs | Persons | 2023/24 | 6.9 | 7.1 | 7.1 | % | |
| B08d - Percentage of people in employment | 16-64 yrs | Persons | 2023/24 | 65.8 | 75.4 | 75.7 | % | |
| B09a - Sickness absence: the percentage of employees who had at least one day off in the previous week | 16+ yrs | Persons | 2021 - 23 | 2.3 | 2.1 | 2.2 | % | |
| B09b - Sickness absence: the percentage of working days lost due to sickness absence | 16+ yrs | Persons | 2021 - 23 | 1.0 | 1.3 | 1.2 | % | |
| B12a - Violent crime - hospital admissions for violence (including sexual violence) | All ages | Persons | 2021/22 - 23/24 | 27.8 | 28.8 | 34.2 | per 100,000 | |
| B12b - Violent crime - violence offences per 1,000 population | All ages | Persons | 2023/24 | 24.7 | 31.7 | 32.7 | per 1,000 | |
| B12c - Violent crime - sexual offences per 1,000 population | All ages | Persons | 2023/24 | 2.1 | 3.0 | 2.9 | per 1,000 | |
| B13a - Reoffending levels: percentage of offenders who reoffend | All ages | Persons | 2022/23 | 20.0 | 27.6 | 26.2 | % | |
| B13b - Reoffending levels: average number of reoffences per reoffender | All ages | Persons | 2022/23 | 2.7 | 4.2 | 4.0 | per re-offender | |
| B14a - The rate of complaints about noise | All ages | Persons | 2023/24 | 6.9 | 5.3 | 5.9 | per 1,000 | |
| B14b - The percentage of the population exposed to road, rail and air transport noise of 65dB(A) or more, during the daytime | All ages | Persons | 2021 | 2.9 | 3.0 | 4.3 | % | |
| B14c - The percentage of the population exposed to road, rail and air transport noise of 55 dB(A) or more during the night-time | All ages | Persons | 2021 | 6.7 | 6.2 | 8.4 | % | |
| B15a - Homelessness: households owed a duty under the Homelessness Reduction Act | Not applicable | Not applicable | 2023/24 | 5.7 | 11.2 | 13.4 | per 1,000 | |
| B15c - Homelessness: households in temporary accommodation | Not applicable | Not applicable | 2023/24 | 0.6 | 1.6 | 4.6 | per 1,000 | |
| B17 - Fuel poverty (low income, low energy efficiency methodology) | Not applicable | Not applicable | 2023 | 11.8 | 11.7 | 11.4 | % | |
| 1.01i - Children in low income families (all dependent children under 20) | 0-19 yrs | Persons | 2016 | 14.9 | 16.3 | 17.0 | % | |
| Source: OHID Fingertips | ||||||||
| C. Health Improvement | ||||||||
|---|---|---|---|---|---|---|---|---|
| Indicator | Age | Sex | Period | Value | East Midlands region | England | Unit | Recent Trend |
| C01 - Total prescribed LARC excluding injections rate / 1,000 | All ages | Female | 2023 | 48.0 | 45.7 | 43.5 | per 1,000 | |
| C04 - Low birth weight of term babies | >=37 weeks gestational age at birth | Persons | 2022 | 1.3 | 2.6 | 2.9 | % | |
| C06 - Smoking status at time of delivery | All ages | Female | 2023/24 | 8.9 | 9.9 | 7.4 | % | |
| C09a - Reception prevalence of overweight (including obesity) | 4-5 yrs | Persons | 2023/24 | 19.2 | 22.0 | 22.1 | % | |
| C09b - Year 6 prevalence of overweight (including obesity) | 10-11 yrs | Persons | 2023/24 | 31.2 | 36.0 | 35.8 | % | |
| C10 - Percentage of physically active children and young people | 5-16 yrs | Persons | 2023/24 | NA | 45.7 | 47.8 | % | |
| C11a - Hospital admissions caused by unintentional and deliberate injuries in children (aged 0 to 14 years) | <15 yrs | Persons | 2023/24 | 58.4 | 54.9 | 72.7 | per 10,000 | |
| C11a - Hospital admissions caused by unintentional and deliberate injuries in children (aged 0 to 4 years) | 0-4 yrs | Persons | 2023/24 | 69.7 | 68.3 | 93.2 | per 10,000 | |
| C11b - Hospital admissions caused by unintentional and deliberate injuries in young people (aged 15 to 24 years) | 15-24 yrs | Persons | 2023/24 | 79.8 | 79.2 | 88.6 | per 10,000 | |
| C14b - Emergency Hospital Admissions for Intentional Self-Harm | All ages | Persons | 2023/24 | 108.8 | 128.1 | 117.0 | per 100,000 | |
| C15 - Percentage of adults meeting the '5-a-day' fruit and vegetable consumption recommendations (new method) | 16+ yrs | Persons | 2023/24 | 26.3 | 30.1 | 31.3 | % | |
| C15 - Proportion of the population meeting the recommended '5 a day' on a 'usual day' (adults) (old method) | 16+ yrs | Persons | 2019/20 | 58.0 | 55.0 | 55.4 | % | |
| C16 - Overweight (including obesity) prevalence in adults, (using adjusted self-reported height and weight) | 18+ yrs | Persons | 2023/24 | 70.3 | 67.1 | 64.5 | % | |
| C17a - Percentage of physically active adults | 19+ yrs | Persons | 2023/24 | 71.2 | 66.7 | 67.4 | % | |
| C17b - Percentage of physically inactive adults | 19+ yrs | Persons | 2023/24 | 19.0 | 22.7 | 22.0 | % | |
| C18 - Smoking Prevalence in adults (aged 18 and over) - current smokers (APS) | 18+ yrs | Persons | 2023 | 7.1 | 12.5 | 11.6 | % | |
| C19d - Deaths from drug misuse | All ages | Persons | 2021 - 23 | 6.9 | 5.4 | 5.5 | per 100,000 | |
| C21 - Admission episodes for alcohol-related conditions (Narrow) | All ages | Persons | 2023/24 | 542.1 | 553.6 | 504.1 | per 100,000 | |
| C21 - Admission episodes for alcohol-related conditions (Narrow) | All ages | Male | 2023/24 | 601.4 | 724.9 | 686.5 | per 100,000 | |
| C21 - Admission episodes for alcohol-related conditions (Narrow) | All ages | Female | 2023/24 | 492.0 | 396.8 | 339.5 | per 100,000 | |
| C22 - Estimated diabetes diagnosis rate | 17+ yrs | Persons | 2018 | 87.1 | 84.6 | 78.0 | % | |
| C23 - Percentage of cancers diagnosed at stages 1 and 2 | All ages | Persons | 2021 | 54.6 | 52.9 | 54.4 | % | |
| C24a - Cancer screening coverage: breast cancer | 53-70 yrs | Female | 2024 | 80.4 | 71.2 | 69.9 | % | |
| C24b - Cancer screening coverage: cervical cancer (aged 25 to 49 years old) | 25-49 yrs | Female | 2024 | 78.5 | 68.2 | 66.1 | % | |
| C24c - Cancer screening coverage: cervical cancer (aged 50 to 64 years old) | 50-64 yrs | Female | 2024 | 80.3 | 75.8 | 74.3 | % | |
| C24d - Cancer screening coverage: bowel cancer | 60-74 yrs | Persons | 2024 | 75.7 | 72.9 | 71.8 | % | |
| C24e - Abdominal Aortic Aneurysm Screening Coverage | 65 | Male | 2023/24 | 89.7 | 86.2 | 81.9 | % | |
| C27 - Percentage reporting a long-term Musculoskeletal (MSK) problem | 16+ yrs | Persons | 2023 | 26.4 | 20.0 | 18.4 | % | |
| C28a - Self reported wellbeing: people with a low satisfaction score | 16+ yrs | Persons | 2022/23 | NA | 6.5 | 5.6 | % | |
| C28b - Self reported wellbeing: people with a low worthwhile score | 16+ yrs | Persons | 2022/23 | NA | 4.4 | 4.4 | % | |
| C28c - Self reported wellbeing: people with a low happiness score | 16+ yrs | Persons | 2022/23 | NA | 9.3 | 8.8 | % | |
| C28d - Self reported wellbeing: people with a high anxiety score | 16+ yrs | Persons | 2022/23 | 22.6 | 21.5 | 23.3 | % | |
| C29 - Emergency hospital admissions due to falls in people aged 65 and over | 65+ yrs | Persons | 2023/24 | 1,513.8 | 1,908.5 | 1,984.0 | per 100,000 | |
| C29 - Emergency hospital admissions due to falls in people aged 65 to 79 | 65-79 yrs | Persons | 2023/24 | 580.1 | 908.4 | 954.7 | per 100,000 | |
| C29 - Emergency hospital admissions due to falls in people aged 80 plus | 80+ yrs | Persons | 2023/24 | 4,221.6 | 4,808.6 | 4,968.9 | per 100,000 | |
| Source: OHID Fingertips | ||||||||
| D. Health Protection | ||||||||
|---|---|---|---|---|---|---|---|---|
| Indicator | Age | Sex | Period | Value | East Midlands region | England | Unit | Recent Trend |
| D01 - Air pollution: estimated fraction of mortality attributable to particulate air pollution | 30+ yrs | Persons | 2023 | 5.3 | 5.6 | 5.2 | % | |
| D02a - Chlamydia detection rate per 100,000 aged 15 to 24 years | 15-24 yrs | Male | 2024 | 723.4 | 908.7 | 837.2 | per 100,000 | |
| D02a - Chlamydia detection rate per 100,000 aged 15 to 24 years | 15-24 yrs | Female | 2024 | 1,981.7 | 1,775.4 | 1,589.4 | per 100,000 | |
| D02a - Chlamydia detection rate per 100,000 aged 15 to 24 years | 15-24 yrs | Persons | 2024 | 1,384.0 | 1,351.5 | 1,249.8 | per 100,000 | |
| D02b - New STI diagnoses (excluding chlamydia aged 24 and under) per 100,000 | All ages | Persons | 2024 | 344.6 | 313.5 | 482.3 | per 100,000 | |
| D07 - HIV late diagnosis in people first diagnosed with HIV in the UK | 15+ yrs | Persons | 2021 - 23 | 100.0 | 47.5 | 43.5 | % | |
| D08a - Proportion of drug sensitive TB notifications who had completed a full course of treatment by 12 months | All ages | Persons | 2022 | NA | 76.5 | 82.8 | % | |
| D08b - TB incidence (three year average) | All ages | Persons | 2021 - 23 | 3.5 | 7.7 | 8.0 | per 100,000 | |
| D10 - Adjusted antibiotic prescribing in primary care by the NHS | All ages | Persons | 2023 | 1.1 | 0.9 | 0.9 | per STAR-PU | |
| Source: OHID Fingertips | ||||||||
| E. Healthcare and Premature Mortality | ||||||||
|---|---|---|---|---|---|---|---|---|
| Indicator | Age | Sex | Period | Value | East Midlands region | England | Unit | Recent Trend |
| E01 - Infant mortality rate | <1 yr | Persons | 2021 - 23 | 4.0 | 4.4 | 4.1 | per 1,000 | |
| E02 - Percentage of 5 year olds with experience of visually obvious dental decay | 5 yrs | Persons | 2023/24 | 15.2 | 21.5 | 22.4 | % | |
| E03 - Under 75 mortality rate from causes considered preventable | <75 yrs | Persons | 2023 | 129.0 | 161.7 | 153.0 | per 100,000 | |
| E03 - Under 75 mortality rate from causes considered preventable | <75 yrs | Persons | 2021 - 23 | 146.7 | 170.1 | 163.7 | per 100,000 | |
| E04a - Under 75 mortality rate from cardiovascular disease | <75 yrs | Persons | 2023 | 51.3 | 80.3 | 77.4 | per 100,000 | |
| E04a - Under 75 mortality rate from cardiovascular disease | <75 yrs | Persons | 2021 - 23 | 64.6 | 80.6 | 77.1 | per 100,000 | |
| E04b - Under 75 mortality rate from cardiovascular disease considered preventable | <75 yrs | Persons | 2021 - 23 | 25.6 | 32.5 | 30.5 | per 100,000 | |
| E05a - Under 75 mortality rate from cancer | <75 yrs | Persons | 2023 | 115.0 | 126.4 | 120.8 | per 100,000 | |
| E05a - Under 75 mortality rate from cancer | <75 yrs | Persons | 2021 - 23 | 114.1 | 125.9 | 121.6 | per 100,000 | |
| E05b - Under 75 mortality rate from cancer considered preventable | <75 yrs | Persons | 2021 - 23 | 45.3 | 50.5 | 49.5 | per 100,000 | |
| E06a - Under 75 mortality rate from liver disease | <75 yrs | Persons | 2023 | 15.7 | 23.6 | 21.9 | per 100,000 | |
| E06a - Under 75 mortality rate from liver disease | <75 yrs | Persons | 2021 - 23 | 18.3 | 22.4 | 21.5 | per 100,000 | |
| E06b - Under 75 mortality rate from liver disease considered preventable | <75 yrs | Persons | 2021 - 23 | 15.7 | 20.2 | 19.2 | per 100,000 | |
| E07a - Under 75 mortality rate from respiratory disease | <75 yrs | Persons | 2023 | 39.3 | 33.2 | 33.7 | per 100,000 | |
| E07a - Under 75 mortality rate from respiratory disease | <75 yrs | Persons | 2021 - 23 | 35.3 | 29.4 | 30.3 | per 100,000 | |
| E07b - Under 75 mortality rate from respiratory disease considered preventable | <75 yrs | Persons | 2021 - 23 | 20.4 | 17.8 | 18.0 | per 100,000 | |
| E08 - Mortality rate from a range of specified communicable diseases, including influenza | All ages | Persons | 2021 - 23 | 10.8 | 12.1 | 13.0 | per 100,000 | |
| E10 - Suicide rate | 10+ yrs | Persons | 2021 - 23 | 10.2 | 11.3 | 10.7 | per 100,000 | |
| E11 - Emergency readmissions within 30 days of discharge from hospital | All ages | Persons | 2023/24 | 18.5 | 14.8 | 14.8 | % | |
| E13 - Hip fractures in people aged 65 and over | 65+ yrs | Persons | 2023/24 | 427.7 | 556.0 | 547.1 | per 100,000 | |
| E13 - Hip fractures in people aged 65 to 79 | 65-79 yrs | Persons | 2023/24 | 139.5 | 240.7 | 237.8 | per 100,000 | |
| E13 - Hip fractures in people aged 80 and over | 80+ yrs | Persons | 2023/24 | 1,263.6 | 1,470.3 | 1,443.8 | per 100,000 | |
| E14 - Winter mortality index | All ages | Persons | Aug 2021 - Jul 2022 | −3.1 | 6.5 | 8.1 | % | |
| E14 - Winter mortality index (age 85 plus) | 85+ yrs | Persons | Aug 2021 - Jul 2022 | −0.9 | 8.5 | 11.3 | % | |
| E15 - Estimated dementia diagnosis rate (aged 65 and older) | 65+ yrs | Persons | 2025 | 58.7 | 67.8 | 65.6 | per 100 | |
| Source: OHID Fingertips | ||||||||
Prevalence Maps of Derbyshire
The maps below illustrate various geographies for Derbyshire. LSOAs and MSOAs are geographical divisions used for statistical purposes, allowing for more detailed analysis of local data. In these maps, you can explore various health indicators and data for Derbyshire, providing valuable insights into the area’s health and wellbeing.
Wards Data Not Available
Data for this geography is not yet available. Please check back later.
Districts Data Not Available
Data for this geography is not yet available. Please check back later.
 |
In the top right of the map, you’ll find the ‘Layer Control’ icon. This is an easy way to customise what you see on the map visualisation. Click the ‘Layer Control’ to choose which information is displayed on the map. Pick the indicator that interests you the most, and the map will transform accordingly. |
 Further Analysis & Assessments
Derbyshire Joint Strategic Needs Assessment (JSNA) involves a thorough examination of a specific health problem, exploring its causes, consequences, and underlying factors. It combines various data sources, collaboration with stakeholders, and rigorous analysis to generate insights for evidence-informed interventions and policy changes.
 More Information & Resources
Contributors
Louise Hall, Service Development Officer, North East Derbyshire
Footnotes
North East Derbyshire Area Summary Profile, Derbyshire Observatory↩︎
North East Derbyshire Area Profile, Derbyshire Observatory↩︎
North East Derbyshire Public Health Outcomes Framework, OHID↩︎
North East Derbyshire Area Summary Profile, Derbyshire Observatory↩︎
Public Health Outcomes Framework - at a glance summary, North East Derbyshire, OHID↩︎